
Power meters have transformed the way cyclists train. These devices offer the only objective method to track performance on a bike. Heart rate readings can vary due to caffeine, sleep, and stress. Power measurements, however, provide accurate and dependable data about your effort level.
A power meter works by measuring the force you apply to your pedals. Your effort gets converted into watts, which gives you real numbers to work with. Cyclists have a unique advantage because they can measure their power output directly. This makes power meters the best training tool for riders who want to improve. This blog will help you understand how to choose and use a bike power meter that works for your needs.

A power meter works like your personal performance lab right on your bike. This electronic device fits on your bicycle and measures the power you generate while riding. The technology made its debut in cycling during the late 1980s and became accessible to more cyclists in the early 2000s.
Power meters stand out from other performance tracking tools by providing exact measurements of your physical output. These devices attach to specific parts of your bike's drivetrain - usually the pedals, crank arms, crank spiders, or rear hub. The data from power meters stays accurate no matter the wind, temperature, or how you feel that day. You get reliable baseline measurements to track your improvements over time.
Your power output shows up in watts, which shows how much energy you use each second (joules per second). The math behind this is simple: Power = Force × Distance / Time.
For bike riders, this means:
Your legs create torque as you pedal. The power meter takes this force and combines it with your cadence (pedal rotations per minute). The result shows your power output in watts. This number stays accurate in all conditions, which makes it better than speed or heart rate for tracking how well you're doing.
Small electronic parts called strain gages make power measurement possible. These advanced sensors attach to metal parts of your bike's drivetrain - your crank, pedal, or hub.
The process works like this:
Placing strain gages correctly matters a lot for getting accurate readings. Quality power meters often use custom strain gages placed carefully by hand. Some systems use multiple gages in special patterns to filter out unwanted forces and measure only the power that moves you forward.
Your power meter needs to send your watt measurements to your bike computer or phone. Modern units send this data wirelessly through ANT+ and Bluetooth Smart (also called BLE or Bluetooth Low Energy).
ANT+ came first and many cyclists still use it because it can connect to several devices at once. Bluetooth Smart showed up later with faster data sending - up to 64 times each second - but usually connects to just one device.
Most power meters now come with both ANT+ and Bluetooth Smart to work with different head units. Your bike computer shows this information as you ride, displaying current power along with other stats like average power, normalized power, and time in power zones.
Power-based training has emerged as the gold standard for cyclists at every level in 2026. Power meters produce immediate data that changes the way you ride. You no longer need to guess your training and racing strategy. Cycling power gives evidence-based insights that guide you toward smarter training decisions with measurable results.
Power meters give you a big advantage over traditional training methods with immediate feedback. Your heart rate falls behind your actual effort by several seconds or minutes. Power data responds right away to changes in your riding intensity. You can quickly adjust during intervals or hill repeats and train at exactly the right intensity.
Those watts on your cycling computer tell you exactly how hard you work—not how hard you feel like you're working. This difference matters a lot in structured training. You can maintain your target power output from start to finish during a 20-minute threshold interval. Heart rate alone makes this almost impossible.
Becoming skilled at pacing stands out as the most valuable benefit of training with power. Your power meter helps you measure your effort with great precision. This becomes crucial during races or challenging events.
Here's a common situation: riders often push too hard early in an event without power data. Your watts help you maintain sustainable output and prevent the dreaded "bonk" from using too much energy too soon. You should back off right away if you see 225 watts on your device when you know 200 watts works best for a two-hour event.
Power data also cuts through factors like wind, hills, and temperature that might twist your effort perception. You can maintain the best intensity across different terrain and conditions.
Power meters turn unclear ideas about fitness into solid, measurable facts. You can track improvements with amazing accuracy.
Key metrics that clarify your progress include:
These metrics show performance patterns you might miss otherwise. Rising Efficiency Factor values prove your cardiovascular system adapts well to training—you generate more power at the same heart rate.
Software like TrainingPeaks shows your power data in visual charts that track your fitness journey over weeks and months. You can spot trends and confirm your training works.
Power data warns you early about fatigue and overtraining. This matters most for long-term development. You can spot potential problems before they derail your progress by watching the relationship between power and heart rate.
Lower power outputs at your usual heart rate usually mean you need rest. This knowledge helps prevent the buildup of fatigue that causes injury and burnout.
Advanced metrics like Training Stress Score (TSS), Acute Training Load (ATL), and Chronic Training Load (CTL) help calculate your training burden. You can balance stress with recovery better. Coaches use these metrics to create a "Performance Management Chart"—a visual guide that shows when you're pushing too hard.
Regular monitoring of these values helps you understand how much training your body handles. You make steady progress with fewer setbacks.
Your specific needs, bike setup, and budget will determine the right power meter for you. The market in 2026 offers many options, so you'll need to understand the different types and what makes each one unique.

These systems use strain gages built right into the pedal body or spindle. You can easily move them between bikes because pedal threads follow standard sizes. Popular brands and models include the Garmin Rally, and Look Keo Blade Power.
These pedal systems are super easy to install - just unscrew your old pedals and put the new ones on. In spite of that, they do have some downsides. Their exposed position makes them more likely to get damaged in crashes, and they add extra rotating weight to your drivetrain.
These pedals based power meters can come in different forms. The standard road pedals have been around for a couple of years now, but brands have branched out to making off-road/mountain bike versions now as well.
Crank arm systems place their strain gages on or inside the actual crank arm. Many manufacturers offer left-side only versions that multiply the measured power by two, assuming both legs push equally. These units add minimal weight (10-20 grams) to your bike and cost less than other options.
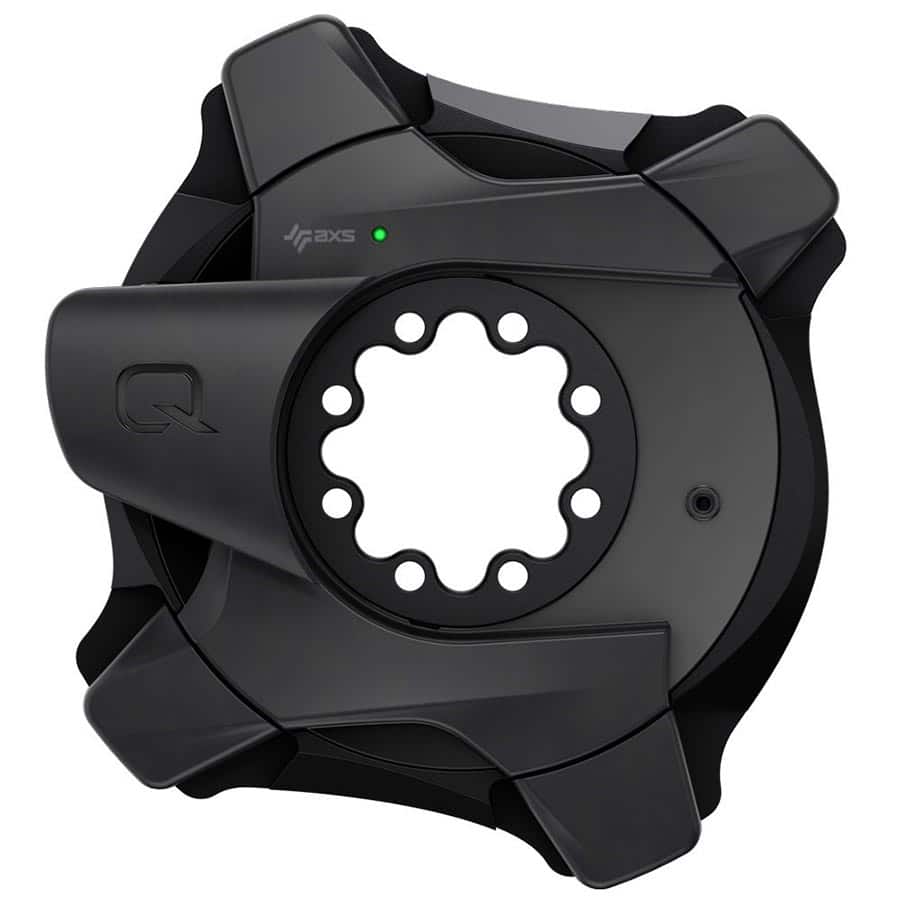
Spider power meters sit between your crank arm and chainrings. They measure force as it moves through the spider. The system captures total power from both legs since all force must go through the spider to move the chain. You'll find options from brands like Quarq/Sram, and Shimano.
Hub-based systems measure power at the rear wheel hub, though they're becoming rare now. These older designs still work great for aerodynamic testing since they measure power after accounting for drivetrain losses.
Indoor training has made smart trainers really popular, and most include power measurement. They connect wirelessly to apps like Zwift and adjust resistance automatically to match virtual terrain. Smart trainers with built-in power measurement eliminate the need for a separate bike-mounted power meter when training indoors.
Here's what to think about when choosing a power meter:
Accuracy: Direct-force power meters deliver +/-1-2% accuracy, with pedal and spider-based units typically achieving +/-1.0%.
Installation: Pedals are easiest to install, then crank arms. Spider units need more technical expertise.
Transferability: You can switch pedal power meters between bikes quickly. Crank-based systems take longer and might have compatibility issues.
Measurement type: Power meters vary in how they measure - some track total power, others measure each leg independently, while some just double the left leg's power. You'll find true left/right measurement mostly in dual-sided pedals and certain crank systems.
Battery life: Rechargeable units last 30-75 hours between charges. Systems with replaceable batteries can run for 120+ hours.
A power meter investment needs proper structured training to reach its full potential. You need to understand some basic concepts that will reshape your cycling approach.
Functional Threshold Power (FTP) is the life-blood of power-based training. It represents the highest wattage you can sustain for about an hour. This vital benchmark sets the foundation for your training zones.
Common FTP testing methods include:

Your training zones split effort into specific intensities based on FTP percentages. The standard seven-zone system works like this:
Your training zones adjust automatically once you know your FTP. Each zone triggers different physiological responses and energy systems. Zone 2 builds aerobic capacity through fat utilization. Zone 4 develops your lactate threshold through glycolytic pathways.
TrainerRoad and Zwift make power-based training easier with FTP-based structured workouts. TrainerRoad excels in science-based training with features like AI FTP detection but lacks visuals. Zwift creates virtual worlds that make training more fun.
You can run both apps at once. Connect TrainerRoad through ANT+ to control resistance while Zwift provides the visual experience. Your trainer's controllable feature should connect to just one app to avoid resistance issues.
Your cycling power meter becomes a valuable training tool when you know how to interpret the numbers it provides. Raw data transforms into practical training decisions once you understand the essential metrics.
Average power calculates your total power output divided by ride time and includes zeros during coasting. This calculation doesn't tell the whole story about workout intensity. Normalized Power (NP) gives a better physiological picture by weighing intensity variations. A criterium race might show average power of 252 watts with NP of 336 watts, this is a big deal as it means that the effort was much harder. NP uses a complex algorithm that applies 30-second rolling averages raised to the fourth power. This better shows the metabolic cost of variable efforts.
Your effort level compared to your capability shows up in the Intensity Factor (IF), which divides NP by your FTP. An IF between 0.75-0.85 shows an endurance ride, while 0.95-1.05 indicates threshold work. Training Stress Score (TSS) combines intensity and duration into one detailed metric. You get 100 TSS from a one-hour ride at FTP. Moderate fatigue needing 1-2 days recovery comes from 150-300 TSS.
Efficiency Factor (EF) shows cardiovascular improvements by dividing NP by average heart rate. Higher fitness means more watts at the same heart rate. To cite an instance, see the difference between producing 200 watts at 140bpm (EF=1.42) and later achieving 200 watts at 133bpm (EF=1.50). This shows real aerobic development.
You can make precise training adjustments without formal testing by using power data. Your true threshold becomes clear when you analyze heart rate responses to power outputs. You're likely below FTP when your heart rate stays stable during intervals. Your threshold gets exceeded when heart rate increases disproportionately between similar intervals. These insights help you fine-tune your zones and ensure optimal training adaptations.
Power meters have changed everything about how cyclists train and perform. This piece shows how these devices give us hard numbers instead of relying on gut feel or heart rate alone. Of course, knowing how to measure your exact output in watts turns random rides into focused, purposeful training sessions.
Power meters aren't just for elite athletes anymore. They've become must-have gear for cyclists at every level who want to get better. Your power meter shows the real story about your performance, whatever the weather or how you feel that day.
The market now offers so many power meter options that you'll easily find one matching your needs and budget. Manufacturers have created solutions for pretty much every bike setup and riding style. You can choose between portable pedal-based systems or tough crank-mounted units.
A power meter's real value comes from what you do with its data. Your power numbers become useful when you plug them into a structured training plan with clear zones based on your FTP. This lets you design precise workouts that target specific fitness gains.
Without doubt, getting started might feel overwhelming. But once you understand the core metrics like Normalized Power, Intensity Factor, and Training Stress Score, you'll learn about your performance in ways you couldn't calculate before.
Here's the truth - a power meter is one of the most important investments in your cycling experience. Unlike lighter wheels or a more aero frame, a power meter helps you become stronger and more efficient through data-driven training. As we direct ourselves through the cycling world of 2026, power meters remain essential tools to discover the full potential of any serious cyclist.


